Key Metrics & KPIs Consulting Business Owners Should Track
Jan 10, 2025
Estimated Reading Time: 31 minutes
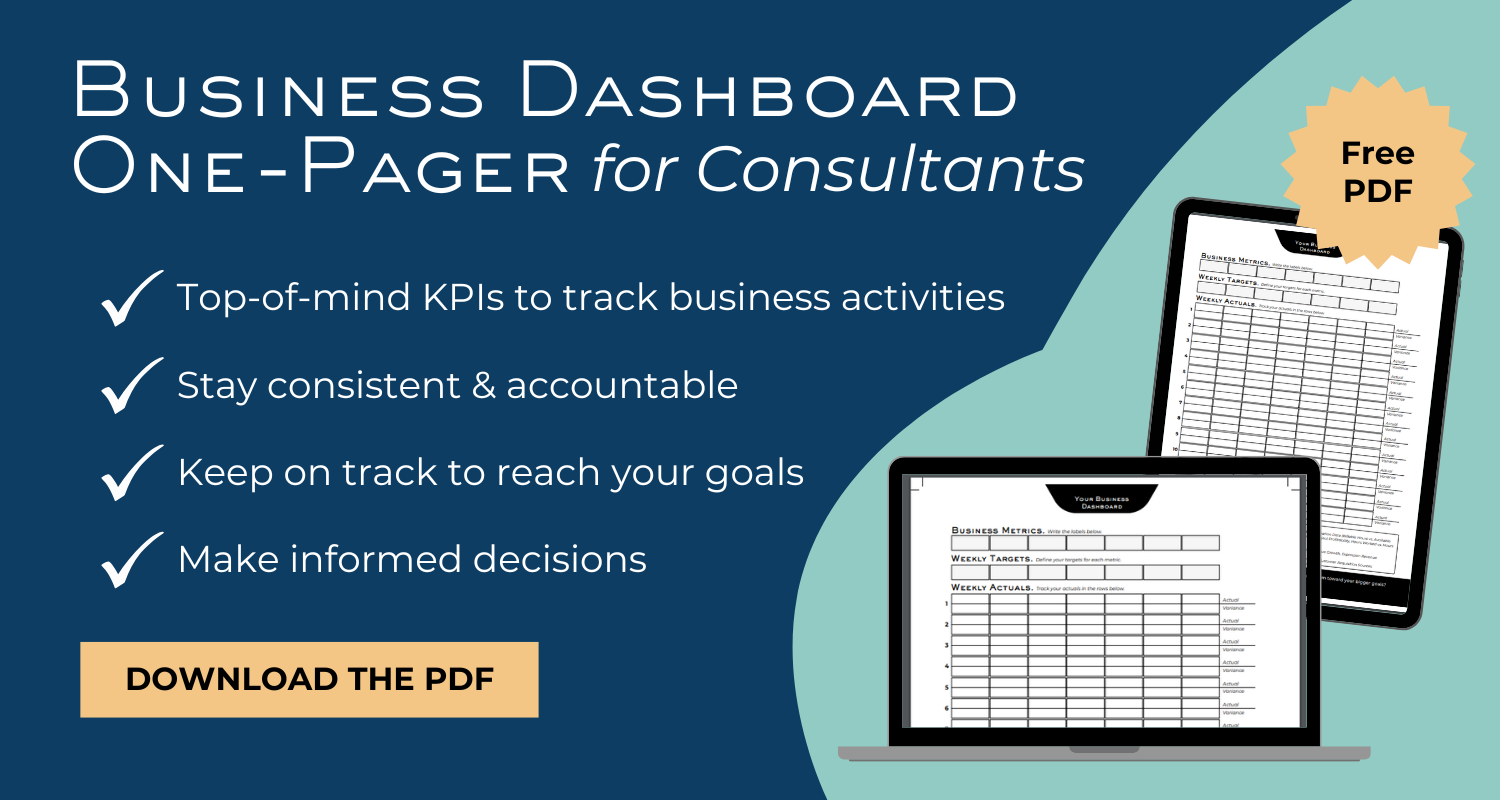
Download the article as a PDF:

Table of contents
- From $30K to $50K Months: How Metrics Transformed Julia’s Business
- Who is this guide for
- Why should consulting business owners track metrics and KPIs?
- Which metrics and KPIs should you track as an independent consultant?
- Which metrics should you focus on if you’re just getting started (and why)?
- How often should you evaluate your consulting metrics, and what is the best method to track them?
- What KPIs should you include in your consulting dashboards
- The 7 Steps to Create Your Consulting KPI Dashboards
- Learn how to use metrics and KPIs to grow your independent consulting firm the right way
From $30K to $50K Months: How Metrics Transformed Julia’s Business
Julia is an independent consultant who had built a steady $350k business after leaving her corporate career. Quarter after quarter, she felt a sense of pride knowing she had successfully replaced her corporate compensation while doing work she truly loved.
But despite her accomplishments, she couldn’t shake the frustration that her business wasn’t growing. She was stuck at the same revenue level year after year, unsure of how to break through to the next stage.
When Julia came to me, she shared her goals of growing her business to $500k+. To start, I asked her to break down what was driving her current results. She responded with, “My clients come from word of mouth.” But when I pressed for details—“What’s the size of your pipeline? How many leads do you need to hit your revenue goals? What activities are driving those word-of-mouth referrals?”—she realized she didn’t have the answers.
Julia admitted that she had no system in place to track the performance of her business. She relied on instincts and generalities, but the lack of specific data made it nearly impossible for her to pinpoint what was working and where she could improve.
That was her lightbulb moment: she needed processes to track and evaluate her business metrics and KPIs if she wanted to grow.
Together, we implemented a system to capture the key metrics driving her business. Julia began tracking her pipeline size, her lead conversion rates, and the specific activities that generated referrals. We identified her leading indicators—those early signs of future revenue—like the number of referral requests made and the follow-up conversations she initiated. These insights gave her a clear picture of where to focus her time and energy.
With this new clarity, Julia didn’t just hit her goals—she surpassed them. Within six months, she advanced from earning $30k months to $50k months consistently. The data empowered her to make smarter decisions, refine her strategies, and confidently grow her business. For the first time, she wasn’t just maintaining her success—she was solidly on the path to bringing her 3 year business vision to life.
Who is this guide for
If you're an independent consultant looking to grow your business, this guide is for you.
I know what it’s like to juggle everything—client work, business development, and keeping the day-to-day operations running smoothly. It can feel overwhelming, especially when you’re unsure which numbers actually matter.
That’s why I created this guide: to give you a straightforward plan for tracking the right metrics and KPIs so you can make confident decisions, strengthen your client relationships, and grow your revenue without the guesswork.
I’ve been where you are, wondering if I’m charging enough, questioning which clients are worth the effort, or feeling stuck because I wasn’t sure if I was spending my time on the right things. It’s frustrating, and let’s be honest—there’s always a fear of missing something important or making a mistake that sets you back. I get it. That’s exactly why I’m sharing this with you—to help you avoid those pitfalls and stay focused on what will truly move the needle for your business.
Over the years, I’ve helped countless independent consultants, like you, shift from feeling overwhelmed and stuck to feeling in control of their business. Whether it’s helping them simplify their processes, improve profitability, or even double their revenue by using metrics strategically, I’ve seen how powerful it can be to focus on the right numbers.
And I want that for you too.
This isn’t just another generic article. It’s built on real experiences—mine and those of the consultants I’ve worked with. I’ve tailored it to address the unique challenges that come with running your own consulting practice. If you’re ready to feel more confident and in control, let’s dive in together and get started.
Why should consulting business owners track metrics and KPIs?
As a consulting business owner, your time is valuable, and every decision you make has a direct impact on your business’s success. Tracking metrics and KPIs (Key Performance Indicators) isn’t about “doing things right”—it’s about gaining clarity and control over how your business performs.
You already know this. In fact, you might even advise your own clients on the importance of tracking their KPIs and metrics. But applying this same level of rigor to your own business can feel surprisingly difficult. It’s easy to get caught up in client work or day-to-day operations, leaving little time to focus on the numbers that truly drive growth.
Before we dive in, let’s take a moment to revisit why tracking your business metrics is so crucial:
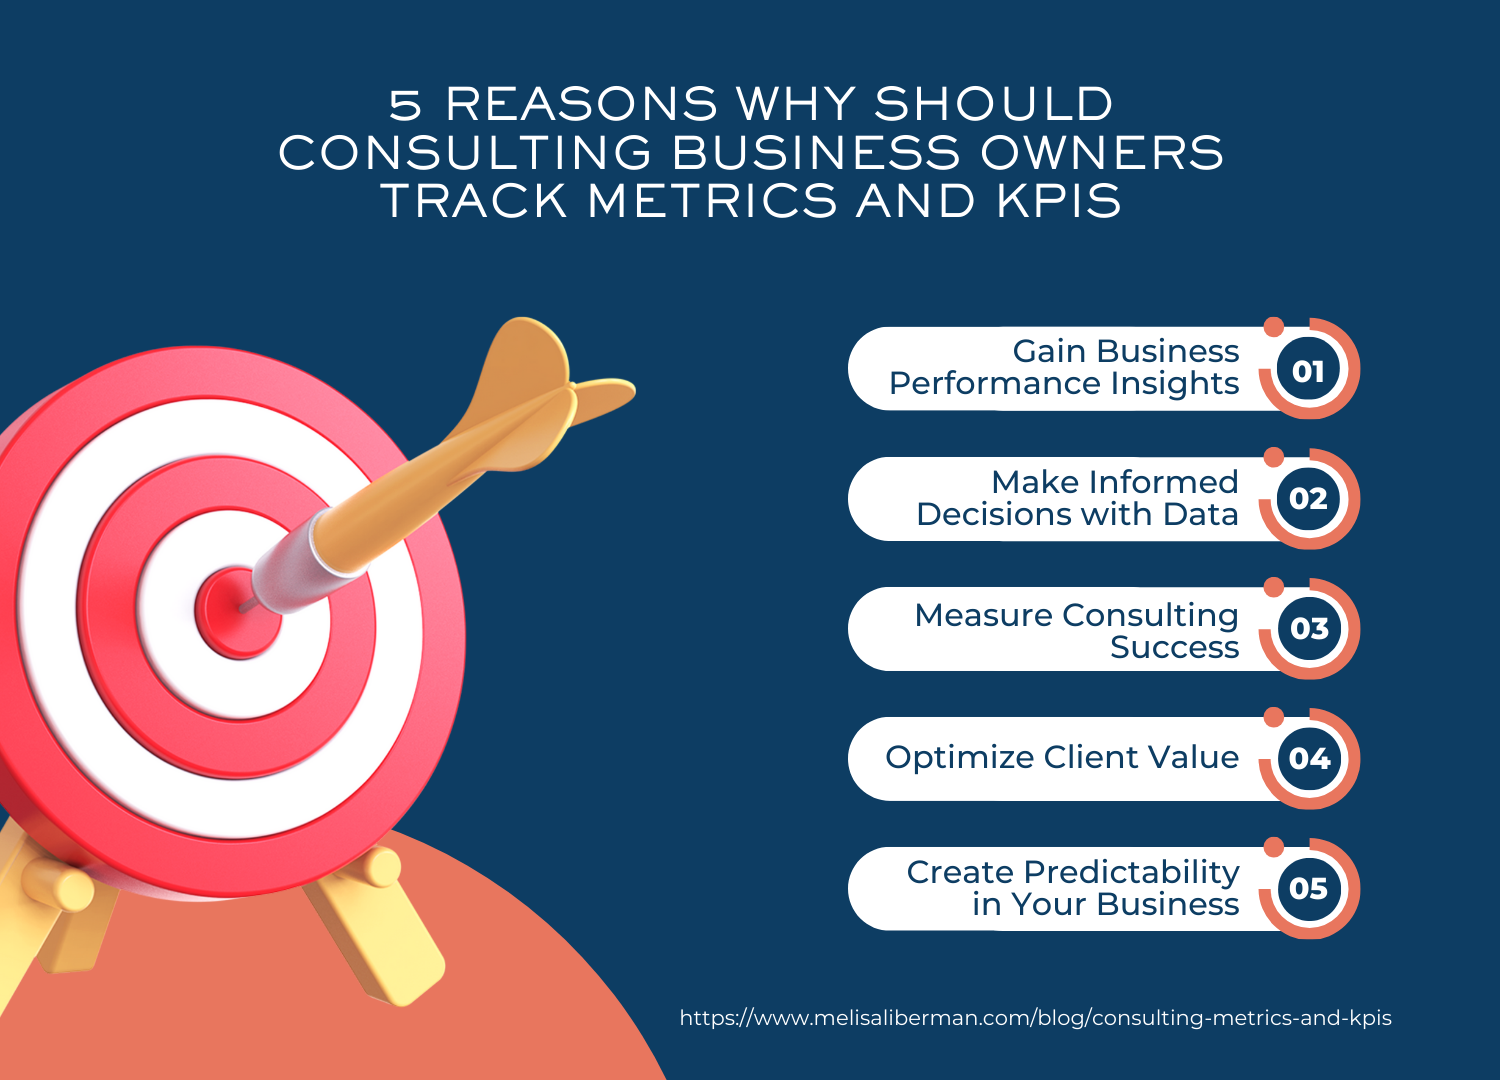
Gain Business Performance Insights
Metrics provide a clear, measurable view of your business performance. They show you what’s working, what’s not, and where there’s room for improvement. For example, tracking your goals vs. actuals, your business activities, and your effective rate can help you pinpoint opportunities to grow or address inefficiencies before they become bigger problems.
Make Informed Decisions with Data
Running a consulting business means constantly making decisions such as pricing, which clients to prioritize, and how to allocate your time. Without data, these decisions can feel like guesswork. KPIs turn gut instincts into informed actions, helping you back up your strategies with facts. For instance, understanding your cost-per-lead can help you refine your marketing efforts to attract high-value clients.
Measure Consulting Success
Success as a consultant can mean different things—profitability, client satisfaction, or achieving personal work-life balance. Tracking KPIs allows you to measure success based on your unique goals. It ensures you’re not just busy but productive, steering your business toward what matters most to you.
Optimize Client Value
Your clients are the heart of your business. By tracking client-focused KPIs like qualitative results and quantitative results, you can gain valuable insights into how to improve their experience. These metrics help you build stronger relationships, increase loyalty, and even create opportunities for repeat business or referrals.
Create Predictability in Your Business
Metrics provide early warning signs of potential challenges—like cash flow issues or feast or famine gaps in revenue—so you can address them before they affect your bottom line.
Tracking the right metrics and KPIs isn’t just about numbers; it’s about building a business that aligns with your goals, serves your clients effectively, and continues to grow sustainably. By staying on top of your data, you gain the insights to not only measure success but actively create it.
Which metrics and KPIs should you track as an independent consultant?
Now that we’ve covered why to track metrics and KPIs let’s talk about what metrics and KPIs you can track as an independent consultant.
But first, here’s a word of warning for you.
This is a list of all the possible metrics you could track.
Don’t track all of these.
Tracking every possible metric is not valuable for you or your business. It can quickly become busywork and non-value added.
The key is to focus on what truly matters for your specific business and goals. This list includes a wide range of metrics across financials, operations, client relationships, marketing, and mindset.
Rather than trying to track them all, take a step back and identify the three to ten metrics that align most closely with your current priorities and long-term objectives. By narrowing your focus, you’ll gain clarity and actionable insights without drowning in data. Less is more.
Let’s dive in and help you choose the ones that will have the biggest impact on your business growth.
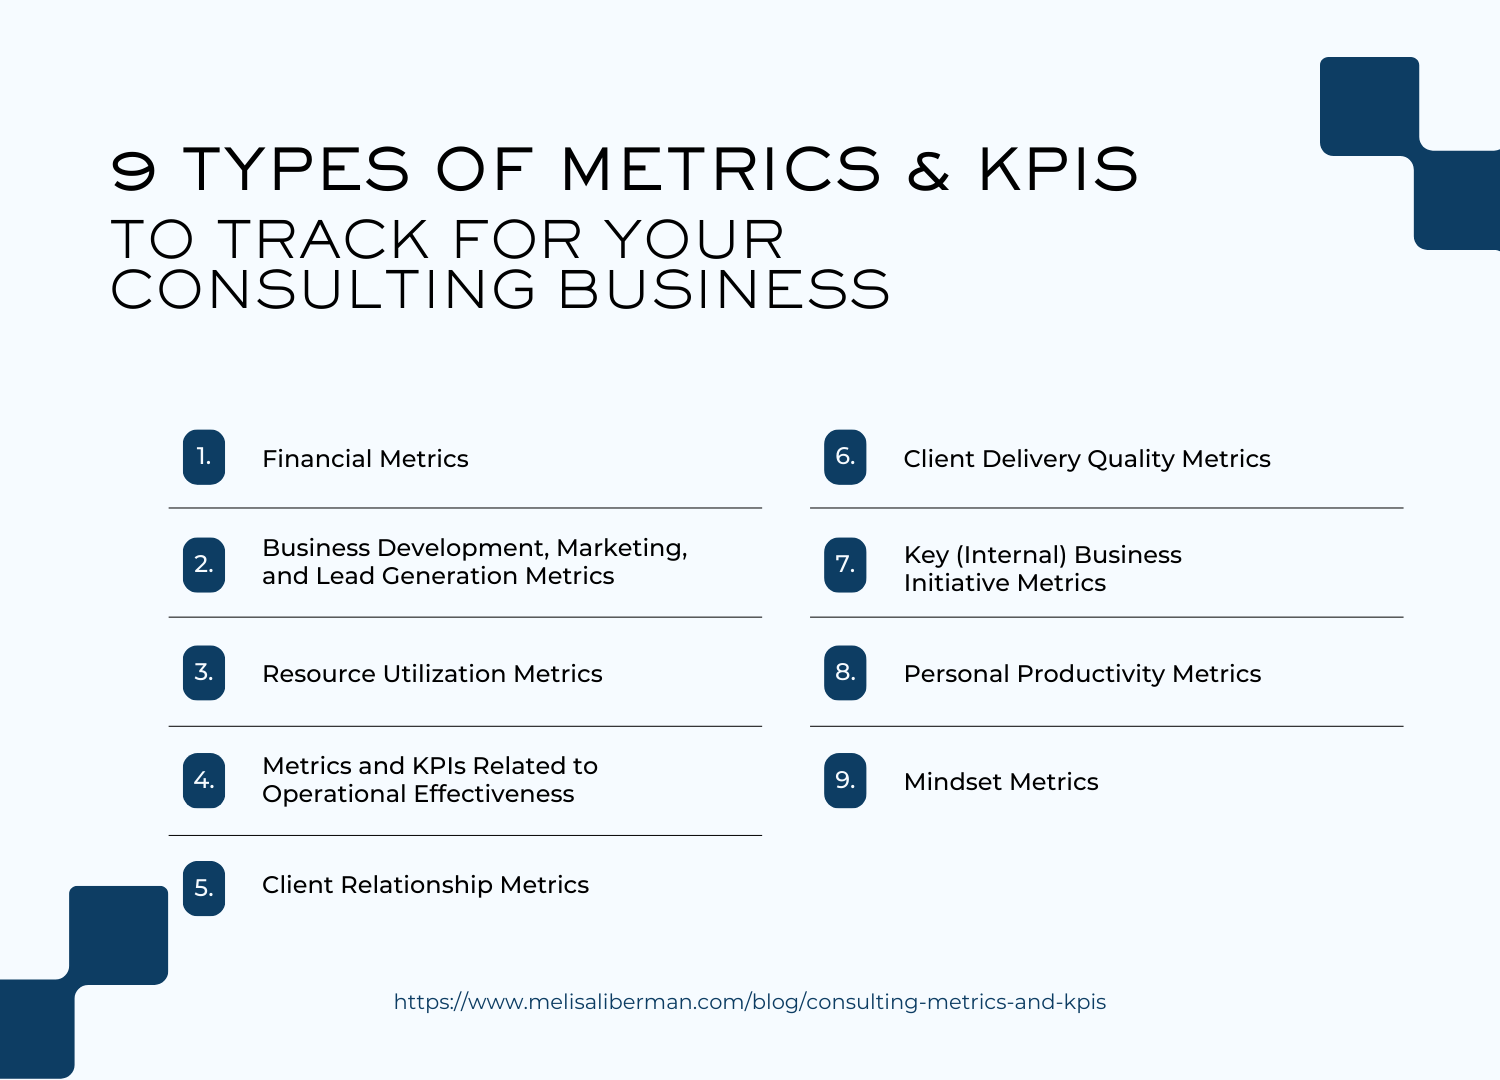
Financial Metrics
- Revenue Growth - Track monthly, quarterly, and annual revenue trends.
- Profit Margins - Measure gross and net profit margins to ensure profitability.
- Cash Flow - Monitor cash inflow vs. outflow to maintain liquidity.
- Expense Tracking - Keep tabs on operational and project-specific costs.
- Tax Liability - Plan for and track tax obligations.
- Budget Planning Metrics - Compare planned vs. actual expenses.
- Revenue by Service Offering - Understand which services drive the most revenue.
- Client Revenue Contribution - Track revenue generated per client.
- Average Revenue Per Client - Assess the value each client brings.
- Accounts Receivable Aging - Monitor unpaid invoices to improve cash flow.
- Revenue Trends and Monthly Breakdown - Identify seasonal or monthly variations.
Business Development, Marketing, and Lead Generation Metrics
- Pipeline Value - Measure the total value of potential deals in your sales pipeline.
- Lead Conversion Rate - Calculate the percentage of leads that become paying clients.
- Cost Per Lead (CPL) - Assess the efficiency of your marketing efforts.
- Marketing ROI - Evaluate the return on your marketing investments.
- Sales Cycle Length - Track how long it takes to close a deal.
- Proposal Win Rate - Measure the percentage of proposals that turn into signed agreements.
- Lead Sources - Track where your leads are coming from (e.g., referrals, LinkedIn, website).
- Content Engagement - Measure how prospects engage with blogs, lead magnets, or other content.
- Marketing-Qualified Leads (MQLs) - Identify leads that meet your ideal client criteria.
- Landing Page Conversion Rates - Assess the effectiveness of your lead magnets and campaigns.
- Booked Appointments - Track how many leads convert into sales calls.
- Target Client Demographics - Analyze the quality and relevance of your leads.
- Website Traffic - Monitor the number of visitors to your site and their engagement.
- SEO Performance - Evaluate rankings, clicks, and impressions for your content.
Resource Utilization Metrics
- Utilization Rate - Measure your percentage of billable hours vs. total working hours.
- Billable Hours - Track time spent directly on client projects.
- Revenue Per Hour - Understand how much revenue is generated per billable hour.
- Non-Billable Hours - Track time spent on administrative or business-building tasks.
- Project Profitability - Calculate the profit margin for individual projects.
- Time Tracking for Consultants - Monitor how time is allocated across tasks.
- Capacity Planning - Ensure resources are aligned with project demands.
- Efficiency Metrics - Track how effectively you’re using time and resources.
- Task Prioritization and Workflow Optimization - Balance workloads between internal and client-focused tasks.
Metrics and KPIs Related to Operational Effectiveness
- Operational Workflows - Track how well processes are functioning.
- Project Management KPIs - Measure timelines, task completion rates, and resource scheduling.
- Delivery Success Rate - Track how many projects meet client expectations and scope requirements.
- On-Time Delivery Rate - Monitor how often projects are delivered on schedule.
- Error Rate - Track mistakes in deliverables to ensure quality.
- Revenue Management - Monitor revenue forecasting, payment cycles, and adherence to budgets.
- Sales Pipeline Management - Track conversion funnel metrics, lead-to-client ratios, and CRM analytics.
- Scope Adherence - Measure how well projects stick to their initial scope.
Client Relationship Metrics
- Qualitative Results - Measure the intangible value your clients derive from the engagement, such as improved team morale, enhanced decision-making, or strategic clarity. Collect this feedback through client interviews, deliverables, testimonials, or surveys.
- Quantitative Results - Track the tangible outcomes of your work, such as increased revenue, cost savings, reduced turnover, or operational improvements. Use baseline data and post-engagement metrics to showcase measurable impact.
- Customer Satisfaction Score (CSAT) - Gauge overall client happiness.
- Net Promoter Score (NPS) - Assess client loyalty and likelihood to recommend.
- Lifetime Value (LTV) of a Client - Estimate the total revenue a client generates over the relationship.
- Repeat Business Rate - Track the percentage of returning clients.
- Client Churn Rate - Measure how often clients leave or fail to renew.
- Client Feedback Score - Collect and analyze client feedback post-project.
- Client Sentiment Analysis - Use qualitative feedback to understand client experiences.
- Client Onboarding Performance - Evaluate the effectiveness of your onboarding process.
- Client Retention Rate - Measure how often clients return for additional services.
Client Delivery Quality Metrics
- Quality of Project Delivery - Measure delivery success rates, client satisfaction, and adherence to scope.
- Post-Delivery Feedback - Collect insights on client satisfaction after project completion.
- Upselling Performance - Track how often existing clients purchase additional services.
Key (Internal) Business Initiative Metrics
- Milestone Completion Rate: Measure the percentage of key milestones within the initiative that have been completed (e.g., 3 out of 5 tasks completed = 60% progress).
- Timeline Adherence: Evaluate whether you’re meeting deadlines for the initiative’s planned milestones and deliverables.
- Resource Utilization: Assess how effectively you allocate time, tools, and support to execute the initiative.
- Progress Checkpoints: Track your achievement of specific checkpoints defined for the initiative, such as finalizing materials, setting up systems, or scheduling key events.
- Percentage of Initiative Budget Used: Track how much of the budget for the initiative has been spent relative to its progress or completion.
- Final Initiative Completion Status: Measure the overall completion percentage of the initiative based on deliverables, tasks, and goals achieved.
Personal Productivity Metrics
- Time Spent on Revenue-Generating Activities - Measure how much time is dedicated to activities that directly grow your income.
- Work-Life Balance Hours - Assess the time you spend away from work to maintain balance.
- Non-Billable Time Efficiency - Evaluate the effectiveness of your non-billable activities in driving long-term results.
Mindset Metrics
- Confidence in Selling - Regularly assess how confident you feel about the value of your services, your ability to sell, and and your ability to drive a potential client to a decision.
- Future-Self Alignment Percentage - Track the percentage of time you spend thinking and acting as your future self—the version of you who has already achieved your goals.
- Resilience Score - Track how well you recover from setbacks or challenges in your business.
- Decision-Making Clarity - Evaluate how confident and decisive you feel when making business decisions.
- Mindset Growth Activities - Track the frequency of activities like journaling, coaching, or mindset training that contribute to a positive and growth-oriented mindset.
- Stress Management - Measure how effectively you manage stress levels during busy periods or challenging projects.
- Management of Self-Inflicted Blockers - Measure how effectively you manage and push through self-doubt, fear, and worries.
- Self-Investment Hours - Log time spent on personal or professional development, such as reading, courses, or attending workshops.
- Vision Alignment - Periodically check whether your daily actions align with your long-term vision for your business and life.
- Imposter Syndrome Frequency - Monitor how often you feel self-doubt or question your qualifications, and identify trends.
- Networking Confidence - Evaluate how comfortable you feel building and leveraging strategic relationships.
- Celebration of Wins - Track how often you acknowledge and celebrate your successes, both big and small.
Which metrics should you focus on if you’re just getting started (and why)?
When you’re just starting as an independent consultant, it’s crucial to focus on metrics that directly impact your growth and provide clarity on how to build a sustainable business. At this stage, your metrics should center around three key areas: setting clear revenue goals, creating activities to generate leads and build a pipeline, and tracking your progress against those goals.
1. Set Revenue Goals
Your first step is to define your financial target. Ask yourself:
- What is your desired monthly or annual revenue?
- How many clients or projects do you need to achieve that goal based on your pricing?
For example, if your goal is $120,000 per year and you charge $10,000 per project, you know you’ll need to secure 12 projects per year, or one per month. This clarity helps you reverse-engineer your activities and priorities.
Key Metric to Track:
- Revenue Goal vs. Actual Revenue - Monitor your progress toward hitting your revenue targets on a monthly basis.
2. Activities to Create a Pipeline and Reach Goals
Revenue goals don’t mean much without a pipeline of opportunities to support them. As a new consultant, focus on lead-generation activities that align with your ideal client. This might include networking, creating thought leadership content, building referral partnerships, or directly pitching prospects.
You also need to measure how effectively these activities generate leads and move them through your pipeline. For example:
- How many new leads are you generating each week?
- How many proposals or conversations are converting into signed agreements?
Key Metrics to Track:
- Number of Leads Generated - Count the number of prospects entering your pipeline each week.
- Pipeline Value - Measure the total monetary value of opportunities in your pipeline to ensure it supports your revenue goals.
- Lead to Opportunity Conversion Rate - Track the percentage of conversations that turn into opportunities
- Sales Close Rate - Track the percentage of opportunities that become paying clients.
3. Compare Actuals Against Goals
Once you’ve established your revenue goals and begun pipeline-building activities, it’s essential to evaluate how you’re performing against those goals. This ensures you can adjust your strategies in real-time. For example, if your pipeline is smaller than needed, you may need to increase outreach or refine your messaging to attract higher-value clients.
Regularly review:
- Are you generating enough leads to meet your revenue targets?
- Are your leads converting at a rate that supports your goals?
- Are your efforts in line with your cost of acquiring new clients (CAC)?
Key Metrics to Track:
- Revenue-to-Goal Ratio - Compare how much revenue you’ve generated against your monthly or annual target.
- Customer Acquisition Cost (CAC) - Measure how much you’re spending (time or money) to land each new client.
- Activity-to-Conversion Ratio - Track the effectiveness of each activity (e.g., networking or email outreach) in creating paying clients.
Why These Metrics Matter
When you’re getting started, simplicity is key. By focusing on goals, pipeline-building activities, and actual results, you’ll avoid overwhelm and create a clear path to grow your consulting business. These foundational metrics give you a blueprint to build upon as you scale and refine your approach.
How often should you evaluate your consulting metrics, and what is the best method to track them?
Evaluating your consulting metrics regularly is critical to staying on track with your business goals and making data-driven decisions. The frequency and method of evaluation depend on the type of metric and your specific objectives, but a combination of consistent reviews and real-time tracking tools will ensure you stay proactive and responsive.
Weekly vs. Monthly vs. Quarterly Evaluations
Evaluating your consulting metrics regularly is critical to staying on track with your business goals and making data-driven decisions. The frequency and method of evaluation depend on the type of metric and your specific objectives, but a combination of consistent reviews and real-time tracking tools will ensure you stay proactive and responsive.
Activity-Driven Evaluations
Evaluate specific actions like sales calls, networking conversations, or qualifying calls immediately after they occur. Reflect on what worked, what didn’t, and how the activity contributed to your goals. This real-time feedback allows you to refine your approach and improve outcomes for future activities.
Weekly Evaluation
Review short-term performance metrics like new leads generated, pipeline progress, billable hours logged, and ongoing project timelines. Use this time to identify any immediate adjustments needed to stay on track with monthly goals.
Monthly Reviews
These are ideal for short-term and tactical metrics, such as revenue, cash flow, pipeline value, and lead generation. Monthly reviews allow you to spot trends quickly and adjust strategies if something isn’t working.
Quarterly Evaluations
Use these for long-term, strategic metrics like profitability, customer acquisition costs (CAC), and client retention rates. Quarterly reviews provide a broader perspective on the health of your business and help you make decisions aligned with larger goals.
Yearly Evaluation
Reflect on long-term performance by analyzing annual revenue, profitability, client retention, and overall pipeline effectiveness. Use this evaluation to identify trends, celebrate achievements, and set strategic priorities for the upcoming year.
Recommendation
Combine activity-driven, weekly, monthly, quarterly, and annual evaluations to ensure you’re addressing immediate needs while keeping an eye on long-term objectives.
Use Real-Time Tracking Tools
Real-time tracking tools are invaluable for metrics that require frequent updates, such as your pipeline value, billable hours, or cash flow. Tools like CRMs, project management software, and financial dashboards allow you to monitor performance continuously and address issues as they arise.
Examples of Tools to Consider:
- Financial Tools: QuickBooks, Xero, or Wave for tracking revenue, expenses, and cash flow.
- CRM Tools: OnePageCRM (my affiliate link) or HubSpot for tracking pipeline value, lead conversion rates, and sales performance.
- Project Management Tools: monday.com or ClickUp for tracking resource utilization, project timelines, and task completion rates.
- Data Dashboards: Keep it simple. Leverage tools like Google Sheets or Microsoft Excel to consolidate and visualize key metrics in one place.
Metric Dashboards for Centralized Tracking
Having a centralized dashboard to track your most important metrics simplifies the evaluation process and ensures you’re consistently monitoring performance. Your dashboard should include:
- Real-time metrics: Pipeline size, revenue, lead generation, and project timelines.
- Periodic metrics: CAC, profitability, and retention rates.
- Custom KPIs: Metrics tailored to your unique business goals.
What to Include:
- Revenue-to-goal tracking
- Pipeline value and conversion rates
- Monthly and quarterly cash flow analysis
- Client satisfaction scores (e.g., NPS or CSAT)
- Utilization rates and billable hours
Frequency of Reporting
The reporting cadence depends on the complexity and impact of the metrics:
- Weekly Reporting: For real-time metrics like lead generation, pipeline movement, and billable hours.
- Monthly Reporting: For financial metrics like revenue growth, cash flow, and expense tracking.
- Quarterly Reporting: For strategic metrics like profitability, retention rates, and CAC.
Pro Tip: Build reporting routines into your calendar to ensure consistency. For example, set a recurring “metrics review” session at the end of each month or quarter.
Adjusting KPIs as Needed
Your business evolves, and so should your metrics. Regular evaluations should include revisiting your KPIs to ensure they align with your current priorities. For instance:
- If you’re shifting from growth to profitability, prioritize metrics like gross profit margins over lead generation.
- If you’re focused on scaling, pay closer attention to CAC and pipeline value.
Action Steps:
- Review your KPIs during quarterly evaluations.
- Replace outdated metrics with those that reflect your current goals.
- Test new metrics to refine your insights over time.
Why Consistent Evaluation Matters
Regularly evaluating your consulting metrics ensures you stay aligned with your goals, catch potential issues early, and continuously improve your performance. By combining activity-based, weekly, monthly, quarterly and yearly evaluations with real-time tracking and automated dashboards, you’ll gain the clarity and confidence needed to make informed decisions and grow your consulting business effectively.
What KPIs should you include in your consulting dashboards
Your dashboard is the foundation of your business performance tracking. It should include the most critical KPIs tailored to your goals, giving you actionable insights at a glance.
Be sure to develop your dashboard in alignment with your specific objectives—for example, if your goal is to achieve a specific revenue target, focus on metrics like monthly revenue, pipeline value, and lead conversion rates.
By focusing on the most relevant metrics at weekly, monthly, and annual intervals, you can make informed decisions, course-correct as needed, and measure long-term success.
What KPIs should you include in a weekly dashboard

Your weekly dashboard is designed to keep you focused on the short-term activities that drive progress toward your goals. It provides a snapshot of your immediate performance, helping you identify what’s working, address any issues, and make quick adjustments. By tracking actionable metrics, you can stay aligned with your plans and ensure your day-to-day efforts contribute to your larger objectives.
- Revenue Metrics: Track revenue to date against your goals.
- Lead Generation Metrics: Track the number of new leads generated, their sources, and any follow-ups completed during the week.
- Pipeline Progress: Monitor changes in the value of your sales pipeline and the status of key deals (e.g., proposals sent or deals closed).
- Time Usage: Measure time spent on client work (working in the business) versus working on the business to ensure you’re focusing on a mix of immediate and longer-term revenue-generating tasks.
What KPIs should you include in a monthly dashboard

A monthly dashboard helps you take a step back and evaluate the broader trends in your business. It bridges the gap between your weekly actions and your quarterly or annual goals, providing a clearer view of your performance. By analyzing key metrics on a monthly basis, you can refine strategies, address challenges, and maintain steady progress toward your financial and operational targets.
Revenue Metrics - Compare monthly revenue to your goals and track revenue by client and service offering.
Financial Metrics - Analyze your sales closed vs. goal; receivables; cash flow projections
Pipeline Health - Evaluate marketing ROI, leads generated per campaign, and the performance of specific channels (e.g., email click-through rates, social media engagement).
Time Usage - Compare utilization goals to actuals to determine trends and projected resource needs (e.g. subcontractors, internal support, etc.)
Forward-Looking Lead Generation Metrics - Look ahead at your lead generation metrics to ensure you’ve set yourself up for success with activities such as speaking engagements, podcast interviews, guest authoring, etc.
Forward-Looking Capacity Metrics - Look ahead at your availability and projected utilization to determine your available capacity.
What KPIs should you include in a quarterly dashboard

Focus on these 3-5 KPIs to gain clear, actionable insights into your business performance each quarter:
- Quarterly Revenue vs. Goal: Track total revenue for the quarter and compare it to your targets to assess whether you're on track for annual revenue goals.
- Pipeline Health: Measure the total value of your sales pipeline, including weighted contract values for active deals, to forecast future revenue.
- Financial Metrics: Analyze your sales closed vs. goal; receivables; cash flow projections
- Profitability Metrics: Review gross and net profit margins, by engagement, to ensure your business remains financially healthy and efficient and as inputs for your pricing
- Pipeline Conversion Rates: Analyze your pipeline flow, including the percentage of conversations that convert into leads; lead sources; percentage of leads that are qualified; percentage of leads that turn into paying clients
- Proactive Lead Generation Metrics: Assess your lead generation efforts for the upcoming quarter to ensure you’ve lined up opportunities like speaking engagements, podcast appearances, or guest writing to maintain a healthy pipeline.
- Projected Capacity Metrics: Evaluate your upcoming schedule and anticipated utilization rates to confirm you have the capacity needed to meet client demands and take on new opportunities.
What KPIs should you include in an annual dashboard

An annual dashboard provides a high-level view of your business's performance, focusing on achieving your goals and setting the stage for future growth. Here are the key KPIs to consider:
- Annual Revenue vs. Goal: Compare your total revenue for the year against your annual target to assess overall success and identify trends or gaps.
- Pipeline Health: Evaluate the total value and quality of your sales pipeline, including average deal size, number of opportunities, and win rates, to understand your readiness for future growth.
- Sales Effectiveness: Track metrics like proposal win rate and sales cycle length to measure how efficiently and effectively you're converting leads into clients.
- Client Retention and Lifetime Value (LTV): Assess how well you’re retaining clients and the total revenue generated per client over time to build long-term stability.
- Lead Generation Capacity: Review the number and quality of leads generated throughout the year to gauge your ability to sustain and grow your pipeline in the future.
This focus on goal achievement, pipeline health, sales efficiency, and future growth capacity ensures you’re positioned to scale and sustain success year over year.
The 7 Steps to Create Your Consulting KPI Dashboards
Building a consulting KPI dashboard involves several steps to ensure it effectively tracks and visualizes the metrics that matter most for your business. Here’s a practical guide to help you create one:
Step 1. Define Your Goals
Start by identifying the consulting business vision and specific goals you want to achieve. Your KPIs should directly align with these objectives.
Example Goals: Increase revenue, improve client retention, optimize time utilization, increase the value of your pipeline, or make more money while working fewer hours.
Step 2. Identify Key Metrics Using the MVP Concept
Start small by focusing on a Minimum Viable Product (MVP) version of your consulting dashboard. Identify the 3-5 metrics most critical to your immediate goals. These are the metrics that will provide the highest value with the least complexity to track and analyze.
Example for Consultants:
- If your goal is revenue growth, start with metrics like monthly revenue, pipeline value, and conversation-to-opportunity conversion rates.
- If your goal is making more while working less, start with setting a revenue goal and tracking and analyzing effective rates by service type.
Once the MVP dashboard is in place and delivering actionable insights, you can optimize and expand by adding additional metrics, such as utliization rates, client satisfaction scores, marketing ROI, or customer acquisition cost (CAC). Starting small ensures clarity and reduces overwhelm while providing a strong foundation to build on.
Step 3. Design the Dashboard Layouts
The layout of your dashboard plays a crucial role in how effectively you can interpret and act on the data. A well-organized dashboard ensures that key metrics are easy to find, trends are clear, and insights are actionable.
Key Considerations for Layout Design:
- Prioritize Important Metrics: Place the most critical KPIs—those that align directly with your goals—at the top or center of your dashboard. For example:
- For revenue goals: monthly revenue, pipeline value, and lead conversion rates.
- For operational efficiency: utilization rates and billable hours.
- Group Related Metrics: Organize your dashboard into sections based on categories, such as financial metrics, client metrics, or operational metrics. This helps maintain clarity and focus.
- Use Visualizations Strategically:
- Bar Charts: Compare actual vs. target performance.
- Line Graphs: Show trends over time.
- Pie Charts: Illustrate distributions, such as revenue by client or service type.
- Tables: Present detailed numerical data for quick reference.
- Trackers: Use activity trackers to capture repeated processes and routines, so you can analyze your consistency, uncover obstacles, and identify opportunities
- Highlight Variances: Use color coding or icons (e.g., green for positive performance, red for areas needing improvement) to draw attention to variances from goals.
- Keep It Clean and Simple: Avoid cluttering the dashboard with unnecessary details or too many metrics. Aim for clarity and readability.
Tips for Different Dashboard Types:
- Weekly Dashboard: Keep it concise with a focus on immediate actions. Example: a simple table showing targets vs. actuals for lead generation and pipeline movement.
- Monthly Dashboard: Include more visualizations and high-level summaries to identify trends.
- Quarterly/Annual Dashboard: Use more comprehensive layouts to reflect progress toward long-term goals, with detailed breakdowns where needed.
Pro Tip:
Test your dashboard layout with real data before finalizing it. This ensures it’s intuitive to navigate, and the visualizations clearly communicate the insights you need. The right layout makes your dashboard a practical, decision-driving tool rather than just a static report.
Step 4. Choose Your Tools
Select tools that suit your needs and expertise level. Strike a balance between creating elegant, fully automated dashboards and simple, quick-to-create dashboards that you can evolve and adjust as you learn more about running your business.
Options include:
- Spreadsheets: Google Sheets or Excel for simple dashboards.
- All-in-One Platforms: CRMs like OnePageCRM (this is my affiliate link) or project management tools like monday.com for tracking specific metrics.
Step 5. Implement the Dashboard Layouts
Once you’ve planned your dashboard’s metrics, layout, and processes, it’s time to implement it so it becomes an active tool in your consulting business. Successful implementation ensures your dashboard is functional, easy to use, and integrated into your operations.
Steps to Implement Your Dashboard:
- Set Up Data Sources: Pull in data, whether from a system (e.g., CRM and Quickbooks) and/or from manual processes to capture the information.
- Establish Your Dashboards: Build out the Weekly, Monthly, Quarterly, and Annual views of the metrics and KPIs you want to track
- Create Your Visualizations: Build the dashboard based on your finalized layout. Ensure each visualization (e.g., charts, tables, or graphs) clearly displays the chosen metrics and is easy to interpret.
- Test the Dashboard: Test the dashboard with actual data. Check for:
- Data accuracy and consistency.
- Easy navigation and readability.
- Alignment with your goals and decision-making needs.
Step 6. Operationalize the Dashboards
To ensure your dashboards remain useful and actionable over time, you need a clear process for maintaining and updating them consistently. Operationalizing your dashboards means integrating them seamlessly into your business routines so they become a reliable tool for decision-making.
Steps to Operationalize Your Dashboards:
- Establish an Update Schedule: Set a consistent cadence for updating the data in your dashboards based on their purpose:
- Automate Data Collection: Use tools like Zapier, API integrations, or built-in software reporting features to pull data directly from your systems (e.g., CRMs, accounting software, project management tools). Automation saves time and minimizes errors.
- Assign Ownership: Determine who will be responsible for maintaining and updating each dashboard. If you’re a solo consultant, allocate dedicated time in your calendar to keep your dashboards up to date. As an alternative, you can ask your virtual assistant to take ownership of this process.
- Integrate Into Your Routine: Define your processes for capturing the data needed to keep your dashboards accurate and current. Incorporate dashboards into your regular workflow to ensure they’re consistently used:
- Schedule Regular Review Times:
- Weekly: Focus on short-term adjustments like pipeline movement or lead generation efforts.
- Monthly: Analyze trends and evaluate progress against medium-term goals.
- Quarterly/Annually: Conduct strategic planning based on long-term metrics.
- Use Dashboards in Client Discussions: Share relevant insights during client meetings to highlight progress or opportunities for improvement.
- Incorporate Dashboards into Business Owner Reflection Sessions: Use your dashboards as part of personal strategy reviews to stay focused on priorities and make informed decisions.
- Create a Feedback Loop: Continuously evaluate whether your dashboards are providing the insights you need. Remove metrics that are no longer relevant, and add new ones as your goals evolve.
- Align Dashboards with Your Decision-Making: Make dashboards a natural part of your decision-making process. For example:
- Use pipeline health metrics to prioritize sales efforts.
- Leverage client satisfaction data to identify opportunities for upselling or improving retention.
Pro Tip:
Document your standard operating procedures (SOP) for maintaining and using each dashboard, including how and when data is updated, what tools are used, and how results are reviewed. This ensures consistency and keeps your dashboards operational even as your business grows or changes. It also opens the door to delegating the dashboard-related processes.
Step 7. Regularly Review and Refine
Your KPIs and dashboard should evolve with your business. Schedule regular reviews (monthly, quarterly, and yearly) to ensure the dashboard remains relevant. Add, adjust, or remove metrics as goals shift.
Learn how to use metrics and KPIs to grow your independent consulting firm the right way
Tracking the right metrics and KPIs is more than just a best practice—it’s the key to making smarter decisions, optimizing your time, and growing your consulting business with clarity and confidence. By focusing on the data that matters most, you can take control of your business’s trajectory and achieve your goals faster.
How Coaching for Consultants Can Help
If you’re ready to take your business to the next level, Coaching for Consultants is here to support you. I’ve designed the coaching specifically for independent consultants who want to grow their businesses into a predictable, sustainable business. This includes mastering the art of tracking and leveraging metrics to drive growth.
Whether you’re looking to increase revenue, improve your sales metrics, or optimize your delivery efficiency, this coaching equips you with the tools and strategies to achieve measurable results.
Here’s what you can expect:
- Personalized Guidance: Tailored strategies to identify and focus on the KPIs that align with your unique goals.
- Proven Frameworks: Step-by-step processes to create, track, and act on metrics that directly impact your growth.
- Accountability and Support: A partner to keep you on track and ensure you’re consistently moving toward your goals.
Success Stories
Don’t just take my word for it—consultants who’ve worked with me have seen real, measurable results. Read our client testimonials to see how others have grown their businesses by focusing on the right metrics and building data-driven strategies.
Take the Next Step
If you’re ready to grow your independent consulting firm with clarity and confidence, let’s talk. Book a consultation today to learn more about how Coaching for Consultants can help you unlock your business’s full potential. Together, we’ll create a roadmap to help you achieve your goals, backed by the power of metrics and KPIs.


About